

As yet another typhoon ravaged the Philippines, leaving a wake of destruction, there is not much to like.
The human suffering caused by these mega-storms cannot help but have an emotional effect, especially for those with loved ones in harms way.
When a friend of mine wrote, “The strength and frequency (of today’s storms) is totally different,” it got me to thinking… are they?
Are typhoons worse now than ever?
This simple question wasn’t as easy to answer as I thought. A Google search results in apocalyptic collections such as:
THE TWELVE WORST TYPHOONS OF THE PHILIPPINES
What quickly becomes apparent, is that such lists are organized by casualties or property damage. They tells us something about human suffering, but not a lot about typhoons.
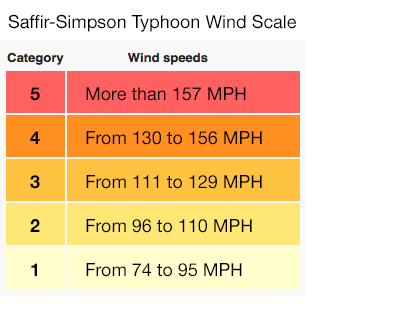
For example, in 1991 Tropical Storm Thelma killed more than 5,000 people with a windspeed of only 50mph, while with a windspeed of 130mph, Category 5 Super Typhoon Ruth killed only 12.
Which one was a worse storm?
Clearly Thelma was worse for human beings, even though at 50mph, it was not even strong enough to be called a typhoon.
Casualty numbers tell us little about the “strength and frequency” of storms. They simply tell us whether the storm hit an area where a lot of people live.
To get a better idea of the long term trend, we’d need to look at the long term data. Good records exist of every typhoon season since 1946, page after page describing every typhoon, storm, and tropical depression.
But no one has seemed to put all the data together in one place to make any trends clearly visible – at least not publicly – until now:
Here are the total number of typhoons in the Pacific per year, since 1946:
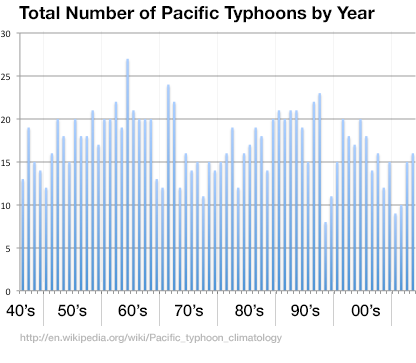
The average number of typhoon level storms per year is 17. Each of the past 8 years has been BELOW average, and though 2014 is not yet over, at 11 typhoons so far, may yet be below average as well.
So much for the idea that typhoons are more frequent today than ever. The 1960’s and 1990’s were much worse. And as far as a trend, it’s sort of downward, but more random than anything else.
But what about the occurrence of the ultra-strong category 5 typhoons? Are they increasing in frequency?
Here’s the data:

Random.
The 50’s and 60’s seemed to have more than their fair share and there was a crazy spike in 1997, but nothing that could be called a trend.
How about Category 4 & 5 typhoons combined?
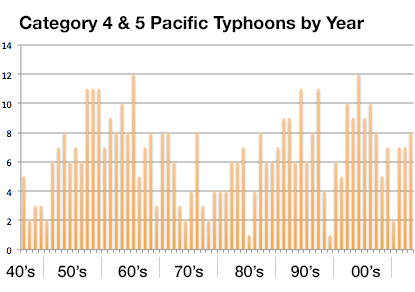
More randomness. The average number of storms per year with windspeed in excess of 130 mph is 6.5, and the past couple of years have been… right around average.
What about the maximum strength of the storms? Are today’s storms more intense than ever?
Here is the data on the maximum sustained windspeed (10 min.) by year:
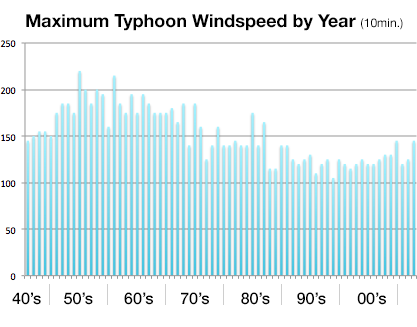
Here more of a trend is visible, and the news appears good, because the wind speeds are down.
Whatever the cause, whether climate change, random weather patterns, or a beneficent universe, who would complain about less severe typhoons?
Surprisingly many people do.
The emotion of the present is always stronger than the facts of the past.